On Wednesday morning, as soon as the news broke that TMI was releasing radioactivity, two professors in the Department of Physics and Astronomy made preparations for taking data. Both professors, John Luetzelschwab and Priscilla Laws, had degrees in nuclear physics and Luetzelschwab had been doing research on radioactivity in soil, so his laboratory was well equipped to take data.
Several physics majors helped with analyzing and plotting data, but one physics major in particular, Lisa Pawelski, quickly assumed a leadership position and directed much of the laboratory work.
The Dickinson nuclear physics laboratory contained an 8.5% efficient Ge(Li) gamma radiation detector connected to a Northern 1024 Multichannel Analyzer with a TTY output. Because the system did not have a plotter, student volunteers made the graphs of counts vs. energy by hand. The samples were massed and placed in Marinelli Beakers for more efficient counting. The standard count time was 20000 seconds (5.5 hours), although a few samples were counted for shorter or longer times. Based on the area of the sample and the fraction of the sample counted, the results of any activity detected were reported in pCi per square foot. (A picoCurie (pCi) is 0.037 decays per second, or one decay every 27 seconds. A pCi is a small activity; the human body contains 1 million pCi of natural radioactive potassium-40)
In addition, the researchers collected and counted some rainwater samples. These were from a downspout at Luetzelschwab’s house. These results are reported in pCi per liter.
Anybody collecting samples around TMI carried a radiation meter to measure the radiation dose rate at the sampling location. However, not all of these readings were recorded, mostly because they were just normal background radiation; however, some may have been forgotten.
At 7:30 on Thursday morning, Luetzelschwab collected a soil sample from his garden. (His house was 2 miles west of TMI, which happened to be downwind for more than a day after the accident.) This sample was 1.5 square foot of soil to a depth of 5/8 to 3/4 of an inch. This sample was designated A-1 (the first sample taken at site A). This sample surprisingly contained radioactive xenon gas (Xe-133 and Xe-135). Noble gasses do not react with anything, so they were not expected to be there. However, the night before some rain fell in the area and xenon is very soluble in water, so the rain washed the xenon out of the air and deposited it in the soil. The calculated activities of Xe-133 and Xe-135 are shown in Table 2. Based on the reported rainfall (0.04 inches) and the xenon activity detected in the soil sample, they calculated the activity in the water; these results are in Table 3. The one other radioactive material of concern was Iodine-131; none was detected in this sample.
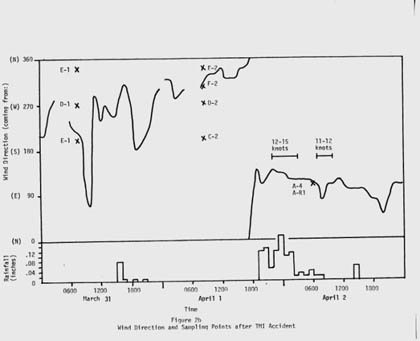
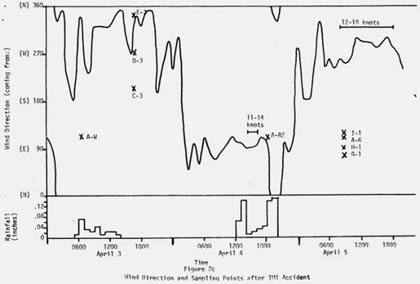
The next day Luetzelschwab collected a second sample from his garden. Then he set up a series of sampling locations that surrounded TMI. The map in Figure 1 shows these locations where he gathered samples over the next three weeks and Figure 2 shows the wind direction at the time of sampling and the rainfall (as reported by the National Weather Bureau). Generally, samples were collected at downwind locations. Table 1 gives the date and sampling time for each location. Tables 2 and 3 give the results of the analyses of these samples. Only samples from location A gave any detectable levels of radioactivity from TMI. No sample showed any I-131 even though the TMI scientists reported some (15 to 30 Ci) was released. (Luetzelschwab used this same sampling/detecting system in October, 1976, to detect fallout from the Chinese atmospheric nuclear weapons test. He readily detected I-131 in these samples.) Table 4 gives the minimum detectable activity. Table 5 shows the measured radiation dose rates that were above background levels.
Concurrently with the soil sampling program, Laws set up a radiation monitoring program at Dickinson (about 20 miles west of TMI). Every few hours, students recorded counts from a Geiger Mueller Tube. Over the two weeks of measuring, the radiation levels never rose above normal background, except after a rain. Rain washed radon progeny out of the air and the decay of these radioactive progeny caused an increase in the count rate.
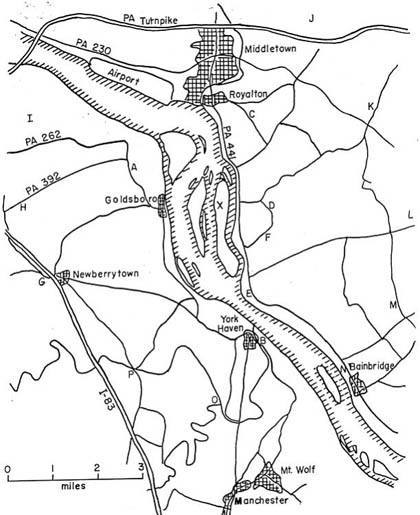
Figure 1: Map Showing Sample Locations
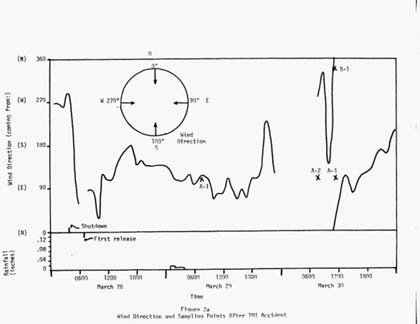
Figure 2: Wind Direction and Sample Collections
*A Roentgen (R) is a measure of exposure to gamma radiation. An mR is one-thousandths of a Roentgen (0.001 R). Normal gamma radiation background from radioactivity in the soil produces 20 to 40 mR of exposure to most every person in the world. See Chapters 1, 2, and 3 in “The 3 R’s; Radiation, Risk, and ReasonThe 3 R’s; Radiation, Risk, and Reason3rs” for a full explanation of the units of radiation dose and exposure.